f How It Works — Portfolio f(x)
← Back to overview
How It Works

How to build a defensible portfolio?

PORTFOLIOf(x) optimises your entire portfolio, not by ranking projects, but by evaluating millions of combinations to find the selection that delivers maximum value within your real-world constraints: budget, shutdown windows, resource limits, and production loss.

1

Score projects

Translate diverse project objectives into a single comparable priority score using weighted multi-criteria analysis.

TOPSIS analysis

Assess each project against your value criteria e.g, financial return, safety, ESG, operational continuity. Weight each criterion against your strategic priorities to produce a single, directly comparable score.

TOPSIS (Technique for Order Preference by Similarity to Ideal Solution) normalises scores against ideal and worst-case benchmarks, so a safety-critical replacement and a value-add expansion can be ranked on the same scale.

Example: criteria weights
ROI0.40
Safety0.30
ESG0.20
Continuity0.10
Σ 1.0000 — balanced weighting

Fig 01 — Weight criteria to your strategy. Adjust weights and immediately see their effect on project rankings.

2

Model the plant

Capture how your assets combine to deliver production value: dependencies, standby, buffers, utility coupling.

Topology modelling

Build a flow model that understands how assets and system flows combine to deliver production revenue: what's critical, what depends on what, where standby exists, how buffers absorb downtime, and how utility failures propagate.

This is what makes PORTFOLIOf(x) production-aware. Without a process model, a portfolio optimiser can't know that taking down Asset A also takes down everything downstream of it.

Asset topology flow graph showing process dependencies

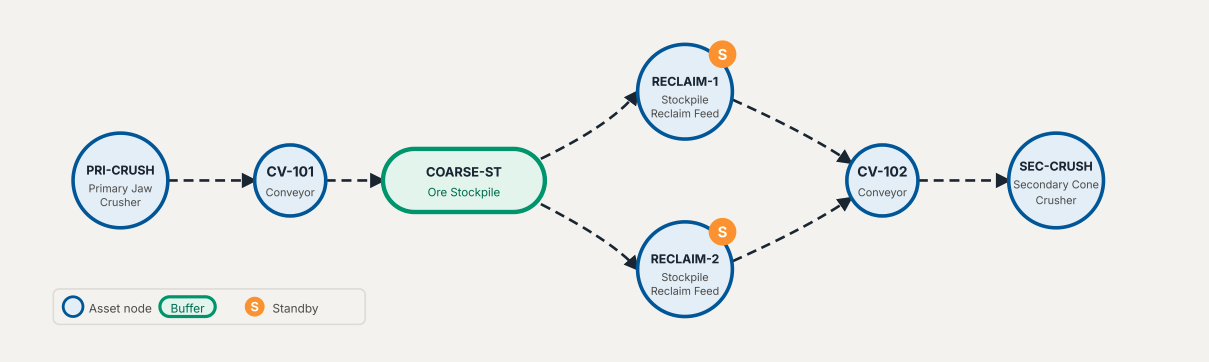
Fig 02 — Asset process flow topology models project interactions for production downtime evaluation and portfolio selection.

3

Optimise the portfolio

Search millions of project combinations to find the highest-value feasible portfolio. Don't rank, optimise.

Hybrid Heuristic Algorithm

Evaluate millions of combinations of projects to find the highest-value solution within budget, shutdown window, resource and production-loss limits. Traditional ranking sorts projects by score then cuts. PORTFOLIOf(x) searches the full combinatorial space.

The value vs production-loss frontier below shows the best achievable portfolio score at each level of allowed production disruption so you can find the knee of the curve and make an explicit trade-off decision.

Value vs production loss Pareto curve

Fig 03 — Portfolio value vs. production-loss ceiling: identifies the optimal tradeoff between capital spend and operational impact.

Deep dive: how production loss is modelled →
4

Explore trade-offs

Interrogate results, test assumptions, and identify robust decisions before you commit.

Scenarios & robustness

Review value vs budget, value vs production loss, and portfolio sensitivity to criteria weight assumptions. Flag marginal projects and identify the ones that hold across different scenarios.

Save runs and compare side by side. Adjust parameters: budget ceiling, shutdown window, resource limits and see immediately how the optimal portfolio shifts.

Pareto frontier: optimal portfolio score at each budget level

Fig 04 — Pareto frontier: optimal portfolio value at each budget level, identifying diminishing returns.

Pareto frontier optimization curve

Fig 05 — Compare result metrics across saved runs side by side; export to Excel for stakeholder review.

Capabilities

What Portfolio f(x) does

A complete set of tools for capital portfolio optimisation in industrial shutdown and campaign environments.

CapabilityWhat it means
Portfolio optimisationFind the best combination of projects based on your objectives and constraints
Production-loss modellingQuantify the production loss for each combination of projects
Shutdown optimisationMaximise the value delivered within the allocated outage window
Resource-constrained planningIdentify portfolios that are achievable with your available trades and equipment
Asset topology modellingUnderstand how equipment interactions in the process flow influence production revenues
Sensitivity analysisHow sensitive are the results to changes in criteria weightings and assumptions
Scenario analysisTest alternative budgets, priorities and constraints in minutes, not weeks
Governance workflowDraft → Review → Submit → Approve → Execute, with full audit trail
AI-generated business casesNarrate defensible recommendations that are executive ready
Questions Portfolio f(x) answers
  • Which projects should we fund this year?
  • What is the highest-value portfolio within our budget?
  • How much production are we sacrificing, and is it worth it?
  • What happens if the budget changes by ±10%?
  • What is the impact of a tighter shutdown window?
  • Which projects survive under different assumptions?
  • Where are our estimates softest before we commit?
f
AI-Generated Business Case

Every run generates a plain-English narrative that explains each decision. Not solver jargon. Clear logic grounded in your numbers.

Example explanation:

"P-08 Substation Upgrade was deferred because the capital budget was exhausted and mechanical resource constraints were binding. To include this project, you would need to either increase the capital budget by $315K, or defer one of five lower-priority projects (Cyclone Reline, Bearing Overhaul, Drive Motor Rewind, Compressor Service) that collectively deliver greater portfolio value."

This level of explanation makes decisions defensible and identifies what would need to change to make a different choice.

Next step

See it run on your portfolio.

Bring a recent planning cycle. We'll model your topology and show the optimised portfolio side-by-side with your current plan.

Book a demo →

info@portfoliofx.io · portfoliofx.io